
First Post of a Series of 4
This post is the first of a series of 4 about the information rate transported by submarine cable systems – the little-talked about long-haul optical transmission infrastructure that underpins global data communications; in fact, you are almost certainly relying on one right now for reading this post! With the development of numerous capacity-hungry applications and cloud-based services, the capacities that must be transported between data centers on different continents are skyrocketing, leading to the crucial need for increasing subsea cable system capacity. This post aims at presenting in a simple way the Shannon limit that drives the ultimate subsea cable system capacity.

The next post (Options for Increasing Subsea Cable System Capacity) will examine the various multiplexing options that can be put at work for increasing subsea cable system capacity and lowering the cost per transported bit as well. The third post of the series will look at some technologies that can be used to approach the Shannon limit with the objective of maximizing the capacity transported by a single communication channel (in our case, a single fiber core). Finally, the last post will review the most recent and significant results from laboratory demonstrations and field trials so one can get a good view of what will be feasible, capacity wise, in the short-and mid-terms.
Below is the first page of the 1948 paper by Claude Shannon that created the field of information theory – and set its research agenda for the next 70 years! Click on the image to access the full paper.
![]()
Shannon Limit Drives Maximal Capacity
The Shannon-Hartley theorem developed in the 1940s tells the maximal rate at which information can be transmitted with zero error, using ideal error-correcting code, over a communication channel of a specified bandwidth in the presence of additive white Gaussian noise:

where
- C is the channel capacity in bits per second, a theoretical upper bound on the net bit rate (information rate) excluding overhead for error-correction codes;
- B is the bandwidth of the channel in hertz;
- S is the average received signal power over the bandwidth, measured in watts;
- N is the average power of the noise and interference over the bandwidth, measured in watts; and
- S/N is the Signal-to-Noise Ratio (SNR) of the communication signal to the noise and interference at the receiver in the bandwidth of the signal (expressed as a linear power ratio, not as logarithmic decibels).
 This upper limit applies to any transmission channel (free space, twisted-pair wire, coaxial cable, optical fiber, etc.).
In the case of optical fiber transmission, a communication channel must be understood as, e.g., a state of optical polarization, a fiber core or a fiber mode.
Shannon Limit Also Drives Maximal Spectral Efficiency
Spectral Efficiency (SE) refers to the information rate, expressed in bit/s and abusively named capacity in our optical networking industry, that can be transmitted over a given bandwidth in a specific communication system based on a given communication channel. Spectral efficiency is obtained by dividing the channel information rate by the channel bandwidth.
This is a measure of how efficiently a limited frequency spectrum (like the optical bandwidth offered by subsea cable system repeaters) is utilized by the optical transport technologies (found for instance inside line terminal equipment). Spectral efficiency is expressed in bit/s/Hz (or more unambiguously in (bit/s)/Hz). In the same way that the Shannon limit caps the information rate that can be transmitted with a specified bandwidth in the presence of additive white Gaussian noise, the Shannon-Hartley theorem also caps the spectral efficiency in the presence of noise:

Advances in optical transmission technologies, coding, signal processing and forward error correction codes allow optical networks to transport higher and higher capacity and operate closer and closer to Shannon spectral efficiency limit. This will be the topic of our next post but, before jumping to that, it is worth spending more time on the Shannon limit itself to better understand its applicability and restrictions when it comes to long-haul optical networks.
Linear Shannon Limit Curve
In optical networking industry, the S/N ratio is measured under the form of Optical Signal-to-Noise Ratio (OSNR), which is the ratio between the signal power and the noise power in a given optical bandwidth (typically 0.1 nm). OSNR are often expressed using the logarithmic decibel scale:
![]()
Although the typical OSNR operation region is 10 to 20 dB, it may be useful to plot the Shannon limit over a wider OSNR range. The chart below represents the Shannon limit for OSNR ranging from 0 to 40 dB, and for ONE channel (one state of optical polarization, one fiber core and one fiber mode).
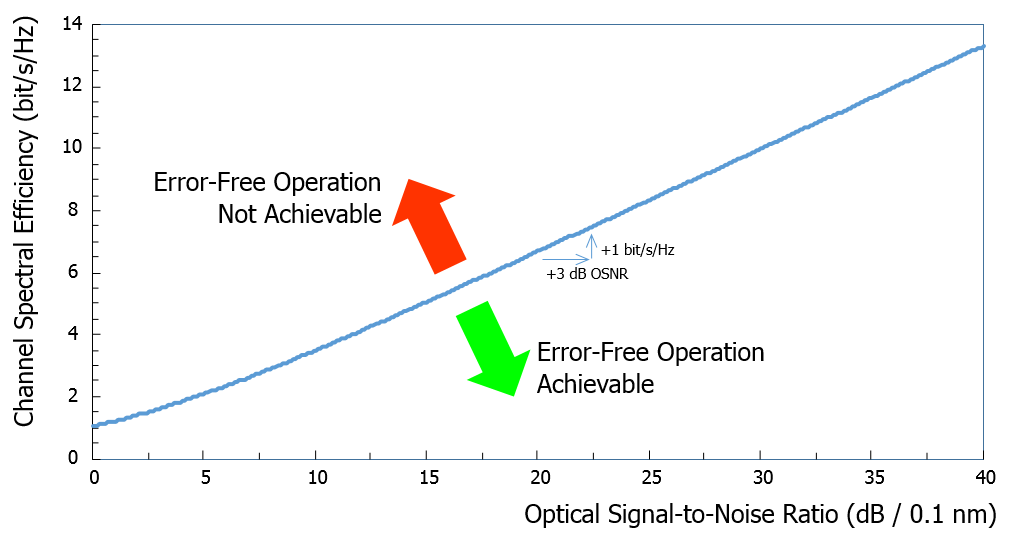
If the communication channel is operated in high OSNR regime, doubling the OSNR (i.e. increasing it by 3 dB) does not double the spectral efficiency. For instance, if the OSNR is 20 dB (signal power 100 times stronger than noise power) in normal operation, doubling the OSNR to 23 dB only increases the spectral efficiency by 1 bit/s/Hz (from 6.7 to 7.7 bit/s/Hz as depicted in the chart above).
Nonlinear Shannon Limit Curve
The Shannon limit was established for a quasi-ideal communication channel, where only additive white Gaussian noise was considered. Propagation inside optical fibers at high-capacity and over long distances requires high optical signal power and the use of periodic optical amplifiers that cause nonlinear effects in the silica material. The main nonlinear effect affecting signal propagation is the Kerr electro-optic effect where the electric field associated with the optical signal(s) produces a change in the silica fiber refractive index. In high-capacity backbone networks (like subsea cable systems), fiber nonlinearities are a major source of signal degradation and reduce the capacity performance of the optical links. The spectral efficiency that can be achieved is governed by the so-called nonlinear Shannon limit, which depends on the actual link technology and design. An example of nonlinear Shannon limits is depicted in the figure below (based on a 2014 presentation from René-Jean Essiambre, Nokia Bell Labs).
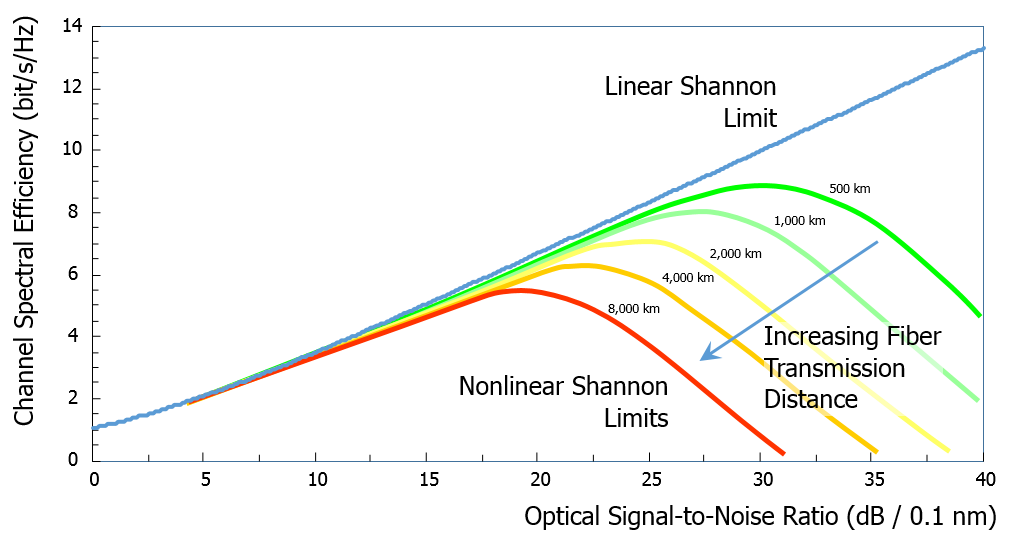
The regions corresponding to spectral efficiencies that can be reached are the areas between the curves and the horizontal axis. The green curve corresponds to a “standard” 500 km optical link with optical amplifiers, optical fibers and optical channel cards exhibiting standard characteristics. The length of the link goes from 500 to 8,000 km, with a doubling factor for each increment. For the green curve (500 km), the maximal spectral efficiency is about 8.8 bit/s/Hz while it is about 5.4 bit/s/Hz for the red curve (8,000 km); a factor of 16 in distance does not lead to a drastic change in the spectral efficiency (the achievable capacity is not “even” halved).
Linear Shannon Limit Curve in Coherent Optical Networks
Modern coherent optical networking equipment uses the optical polarization multiplexing “trick” (see our New modulation format tutorial). The light beam from the laser transmitter is split into two orthogonal states of optical polarization. Each of them is modulated by an independent data stream; then the two states of optical polarization are combined before being launched into the optical fiber. Because the two states of optical polarization are orthogonal, there is no inter-modulation during fiber propagation between the data streams transported by each of them. This technique effectively doubles the amount of data transmitted by a single laser source (emitting a single wavelength) to effectively double the spectral efficiency (as there is no spectral broadening).
This is the reason why the Shannon limit is often graphically represented accounting the two states of optical polarization. The plot below shows the linear Shannon limit over the practical OSNR range of interest where most of the coherent optical networks operate, considering both states of optical polarization.
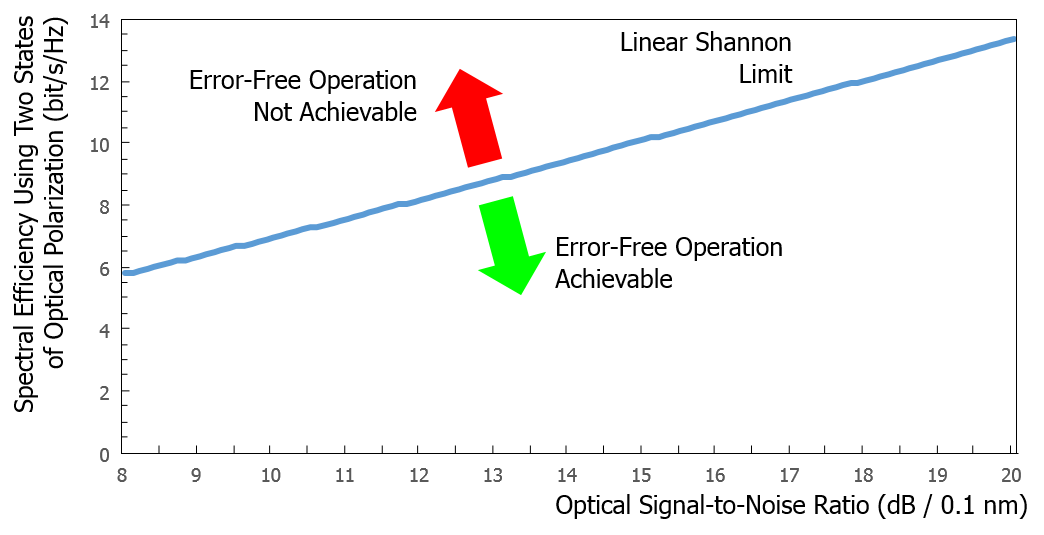
An optical link designed with an OSNR of 13 dB can theoretically allow error-free operation with a spectral efficiency as high as 8.8 bit/s/Hz. The first transmission experiments were far from this figure: for instance, the best laboratory demonstrations 7 years ago achieved only about half of the maximal achievable spectral efficiency. The next post will examine the conditions to approach the Shannon limit and the practical options that are available to optical network designers for getting closer to the Shannon limit.
For comments or questions, please contact us.